
 Makia Freeman – You would think manmade CO2 output levels must be sky-high, given all the relentless guilt-tripping propaganda we are fed about how humanity is the cause of global warming. The agenda to push AGW (Anthropogenic Global Warming) or manmade global warming started around the 1980s and has been gaining momentum for decades, fooling many people along the way.
Yet, despite all the publicity it has gotten, it has still failed to make clear a very fundamental point: exactly how much and what percentage of carbon or specifically CO2 (carbon dioxide) does humanity contribute to the atmosphere?
If man is really driving global warming (now conveniently called “climate change”), surely this level must be pretty high or at least significant, right? The answer may shock you … and give new meaning to the term global warming hoax.
Man-made CO2 Output Levels … Straight out of the IPCC’s Mouth
One of the difficult things about ascertaining the truth in the climate change debate is that there are so many different sets of measurements. Which one do you trust? How can you tell the truth when one side uses one set of data to prove its point, and the other side uses another set of data to prove its (diametrically opposed) point?
To bypass this dilemma, we are going to get the figures straight of the horse’s mouth so to speak by using data from the IPCC (Intergovernmental Panel on Climate Change). The IPCC is not a scientific body as you may imagine but rather a political one with a very clear bias towards promoting AGW and climate change alarmism.
It’s their job to push the AGW agenda onto the public, even though they disguise that with claims that they “provide rigorous and balanced scientific information.”
Here’s what Wim Rost had to say in his article IPCC ≠ SCIENCE ↔ IPCC = GOVERNMENT:
“IPCC is government and not science. And the workers of the IPCC prepare the work in accordance with the rules and procedures established by the IPCC.
“In order to be scientific the scientific method has to be adhered. The use of many scientists to fill important parts of IPCC reports does not mean that everything is science. A report is just a report. In this case, a report from the IPCC. And the IPCC is (inter-) government.
“Scientists involved can produce their own scientific papers about their own specialised part of science, but a small group of writers writes the summaries and the conclusions – for the IPCC. And IPCC is government. …
“The IPCC’s stated mission is not to discover what accounts for climate change, but to assess “the risk of human-induced climate change.”
“Consequently, there is almost no discussion in its lengthy reports of other theories of climate change. Policymakers and journalists took this to mean the AGW theory was the only credible theory of climate change, and the IPCC’s sponsors and spokespersons had no incentive to correct the mistake.”
CO2 in the Atmosphere
Here are the simple facts. Earth’s atmosphere consists of the following gases at the following levels:
Nitrogen (N) – 78%
Oxygen (O) – 21%
Argon (Ar) – 0.9%
Trace Gases – 0.1%
So far, so good. CO2 is a gas in such small concentrations that it hasn’t yet entered the picture. So, the next step is to break down the composition of trace gases (which are also the greenhouse gases) in our atmosphere:
Water Vapor (H2O) – 95% of trace gases / 0.95% of overall atmosphere
Carbon Dioxide (CO2) – 3-4% of trace gases / 0.03 or 0.04% of overall atmosphere
Neon (Ne) – 0.1% of trace gases / 0.001% of overall atmosphere
There are also some gases at tiny concentrations, including helium (He), methane (CH4), nitrous oxide (N2O) and ozone (O3), as well as halogenated gases (CFCs) released by mankind which have damaged ozone.
Water vapor is far and away the largest greenhouse gas, but the IPCC chooses to ignore it! Check out these tables below where you can see that water vapor is excluded from the percentages. The IPCC and other AGW proponents claim they need to exclude water vapor from their calculations because it varies so much from region to region.
Yes, it does vary greatly all over the Earth, but to just exclude the largest greenhouse gas (and a massive driver of temperature too) from your calculations because it’s inconvenient or varies too much is grossly misleading and unscientific.
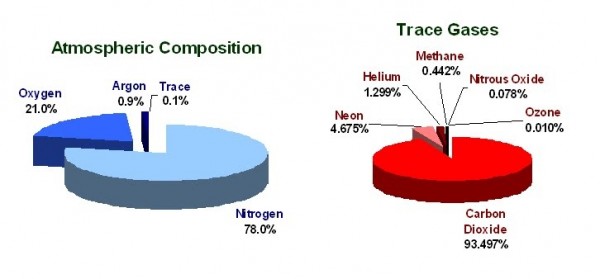
A pie chart typical of one used by the IPCC and AGW proponents. Water vapor, despite being the overwhelmingly largest greeenhouse and trace gas, is simply ignored and omitted.
Humanity’s Contribution to CO2 Levels
To recap: trace gases are 0.1% of the atmosphere, and carbon dioxide makes up 3-4% of these trace gases, so therefore CO2 is 3-4% of 0.1%. For simplicity’s sake, let’s call it 3%, so CO2 comprises 0.003% of the atmosphere.
That’s pretty damn small, but we can’t stop there, because the next question to ask is: how much of this is caused by human activity? The IPCC has conflicting sets of data here, but both are within a small range of each other, either 3.0% (using the 2007 figures) or 3.6% (using the 2001 figures):
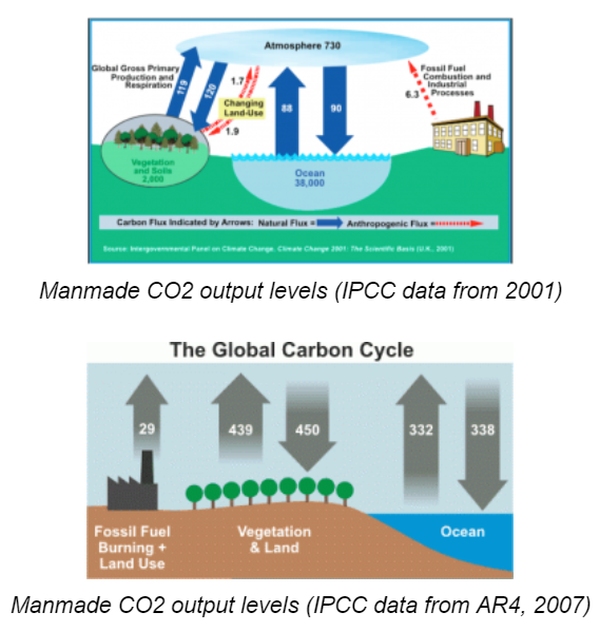
No matter which set of data you use, the IPCC data shows that man-made CO2 output levels are ~3%. How do you figure this out? The 2001 data shows the total amount of CO2 going into the atmosphere (119 + 88 + 6.3 = 213.3) and the human portion as 6.3. Divide 6.3 by 213.3 and you get 2.95%.
The 2007 data shows the total amount of CO2 going into the atmosphere (29 + 439 + 332 = 800) and the human portion as 29. Divide 29 by 800 and you get 3.63%.
Manmade CO2: 3% of 3% of 0.1%
So here’s the bottom line. According to the IPCC’s own data, man-made CO2 output levels are 3% of 3% of 0.1% of the total Earth’s atmosphere. That’s 0.000009%! That’s 9 millionths.
CO2 is measured in ppm (parts per million) because it is such a tiny and insignificant gas, yet somehow, the propaganda has been so successful that is has sprouted into what some state is a US$1.5 trillion industry.
The IPCC Can’t Deal with Water Vapor
The IPCC is basically stuck on water vapor. It can’t actually measure it, since the variability across the world is so high, H2O vapor changes so quickly, and it takes place above a variety of different landscapes/topographies. There are too many variables to calculate to produce a good model. So it just shuffles it to the side and states it has no “confidence.”
Here’s exactly what the IPCC says:
“Modelling the vertical structure of water vapour is subject to greater uncertainty since the humidity profile is governed by a variety of processes … because of large variability and relatively short data records, confidence in stratospheric H2O vapour trends is low.”
It doesn’t suit the IPCC’s agenda to really dive in and better understand the role of water vapor as the key greenhouse gas driving climate temperature. It’s far easier to just pretend it doesn’t exist and only focus on the tiny amount of CO2 in the atmosphere instead.
Manmade CO2: A Massive Diversion
The idea that manmade CO2 output levels is a big problem, in the scheme of all of Earth’s eco problems, is a giant hoax. It diverts environmentalists’ attention away from the true issues that need addressing. Does it make any logical sense to spend so much money, energy and attention on 0.000009% of CO2, when there are very palpable, tangible and dangerous threats to our environment?
What about geoengineering, the aerial chemtrail spraying of barium, aluminum and strontium all over us, and the flora and fauna of the Earth? What about the release of synthetic self-aware fibers that cause Morgellons’ Disease, in line with the NWO synthetic agenda? What about unstoppable environmental genetic pollution caused by the release of GMOs?
What about the contamination of waterways with industrial chemicals, pesticides like glyphosate and atrazine, poisons like dioxin and DDT, heavy metals and pharmaceutical residues? Why are people wasting their energy on 3% of 3% of 0.1% when we have real MASSIVE ENVIRONMENTAL issues facing us as a species?
Respected theoretical physicist Freeman Dyson said:
“The possibly harmful climatic effects of carbon dioxide have been greatly exaggerated … the benefits clearly outweigh the possible damage.”
Final Thoughts
Despite all the politicians, celebrities and soul-for-sale scientists AGW has recruited to its cause, there is no real basis for the fearmongering.
At the very top, those pushing the manmade global warming hoax know that it’s a scam, so rather than focusing on the facts, they appeal to emotion with fake images of starving polar bears (to arouse anger) and underwater cities (to arouse fear).
The truth is that the green movement has long been hijacked by the very same NWO manipulators who helped to ruin the environment in the first place, through their ownership of oil, chemical and pharmaceutical multinational corporations.
These manipulators rely on the average person being too busy or lazy to check the facts or think critically. They promote scientific illiteracy via their control of the MSM, the educational curriculum and their numerous think tanks.
Finally – if you dare – dig into the birth of the modern environmental movement, and you may be shocked to find how deeply it is steeped in eugenics and depopulation. It’s time to realize that those pushing this gigantic scam aren’t interesting in saving the environment – but rather depopulating it.
SF Source HumansAreFree.com Oct 2018
Your main argument is that if CO2 is only 0.003% of the atmosphere, how can even doubling such a small number have any meaningful impact? Let’s test that.
What if we halved CO2 from ~400 ppm to ~200 ppm? That would be the death of the C3 plants, which make up 90% of the plants on the planet. That would pretty much result in no other animal or human life what-so-ever on the planet. So can small absolute changes in something that makes up 0.003% of our atmosphere have a big impact? I rather think it does.
Natural CO2 production figures lack that from vulcanism and other geologic venting. So far this is not fully known. But if known production were included, the man made production would be an even smaller portion of the total.
The calculation needs to be updated slightly given that CO2 levels are now about 0.04% of the atmosphere. I think that it is also interesting to add what the percentage of CO2 world wide could possibly be reduced to if the USA spent $100+ Trillions to somehow reach ZERO emissions of CO2, which is insanely wrong in every way I can imagine. The calculation for world wide man-made concentration of CO2 in the atmosphere would be: 0.04 X 0.03 X 0.001 = 12 millionths. The latest estimate that I could get on the man-made CO2 levels contributed by the USA is about 14%. Therefore, 14% of 12 millionths would be about 1.7 millionths. Subtracting that from the 12 millionths (and assuming that all other countries stay at their present levels) would result in a concentration level of 10.3 millionths. In conclusion: whether global CO2 levels are at 10.3 millionths or 12 millionths, this amount is insignificant compared to the natural causes of CO2: plant and animal decay, volcanoes (thousands under the ocean and on land), lightning caused forest fires, and fluctuations in solar radiation, which amounts to 97% of atmospheric CO2 levels. Only totally deluded minds could conclude that climate change or global warming is caused by man-made CO2 emissions. And to know that water vapor (along with the resulting cloud shadowing, rain, and snow) on the average, as the “elephant in the room” greenhouse gas at average humidity levels has at least a 1,300 times greater impact than CO2 in determining global temperatures. It is clearly wrong that the NWO climate terrorists have totally ignored the affects of water vapor in all of its temperature predicting models.
Just to say, anyone who is interested in a more indepth lecture, on climate change farse
Look up Dr Tim Ball.
odysee.com @TonyHeller dr.tim ball in-sydney november 10 2016
Thanks, Guy
Your thinking is flawed. CO2 may only make up a tiny fraction of the atmosphere but is a gas which is very effective at trapping in infrared light (heat), unlike Oxygen and Nitrogen which do not trap any. CO2 acts as a blanket over the earth. The more CO2 the more heat is trapped in. Think about a greenhouse. They get very hot in the summer. The glass is not very thick but it is effective at keeping the heat in.
CO2 has never been linked to any climate change during the earth history. The amount of CO2 during the several ice ages has been 10-20 times than it is today and yet some ice ages lasted millions of years.
Addition of anthropogent CO2 at 12 millionths of natural production cannot have any significant climatic effect. Also when water vapor is considered, the 12 millionth of CO2 is even less significant.
Historic data and proxy data confirm that global temperatures have fluctuated long before large scale use of hydrocarbon fuels. The climate scare is nothing more than a remake of the Chicken Little story. The sky is not falling.
Weather variation trends are a natural component of climate. They are caused by such natural phenomena solar activity variations and volcanoes. We are still on the receding side of the Little Ice Age which lasted from the early 1300’s to the mid 1800’s. It would not be surprising that present temperatures might be slightly warmer than those of recent history. Recession of the Little Ice Age certainly cannot have been caused by large scale burning of hydrocarbons.
In the story of Chicken Little, it took logical thought and action by Goosey-Brucie to shake the oak tree and prove that the “falling sky” was merely an acorn that knocked the chicken on her head. The panicking barn yard birds of the story eventually yeilded to logic. It is a shame that today’s climate alarmists lack even the logic of those barn yard bird brains.
Serendipitously, the story of Chicken Little was first published during the last years of the Little Ice Age, in 1823 by Just Mathias Thiele in Danish.
so if co2 is now 415 parts per million and man is responsible for .03 of that then .03x 415 is 12.45 ppm so say 13 parts and that 13 parts is coming essentially from modernized countries…figure USA might be contributing 1/3rd of that so .33x 13 is 4.39 so 4.39 per million 1,000,000-4.39=999,995.61 round to 999,996 of other gases. Is that correct or am I missing something ?
The United States and Canada are among the most energy efficient countries on Earth. So are most European countries.
I don’t know if your math is correct. What I do know is that any attempt to claim that humanity is somehow killing the planet due to CO2 emissions is an intentional LIE being spread by people who jet around the skies putting out more pollution in a single flight than Western farms and production facilities COMBINED. That fact should be enough for most thinking humans to realize that this is not a real issue. It is an AGENDA item intended to strip wealthy countries of their wealth and bring DOWN standards of living globally to that of the poorest countries on the planet. There is nothing in this for humanity except loss, penury, and global enslavement. As the WEFers say “you will own nothing and be happy.” -g
So George, I consider you to be much more up on this than myself. But looking at your comment, leaving the author’s alone for a moment, you say that .0000009, i.e. with 6 zeros ahead of the 9, is the number that goes with the words 9 millionths. I would agree.
However .03 x.03 x .1 = one zero less than that at .000009. So it looks to me like the article’s author was correct when he stated that the number or outcome of this equation is .000009 i.e. with 5 zeros ahead of the 9. Where he was incorrect is in stating that that number is 9 Millionths when it is actually 9 hundred thousandths.
So that would mean your further equation that factors in other numbers as you were suggesting would be more accurate would likely be 12 hundred thousandths right? or perhaps that would be better to say 1 in 1.2 M particles?
The blue and red pie charts don’t belong together as they use the term Trace Gases differently. The Blue one is missing 0-4% water vapour with average size 1-2% so it misleading represents “dry atmosphere” that doesn’t exist. The blue pie chart also conveniently doubles up the actual value of 0.045% dry trace gases to 0.1%, instead of properly to 0.0%. If the chart author needs to start using two decimal places. The red one is fine, but next to the blue one it reinforces the incorrect idea that CO2 is almost 0.1%.
This article’s author then goes horribly wrong.
“…carbon dioxide makes up 3-4% of these trace gases, so therefore CO2 is 3-4% of 0.1%. For simplicity’s sake, let’s call it 3%, so CO2 comprises 0.003% of the atmosphere.”. Please check this – you’re first 3% statement is utterly wrong, and then the calculations almost correct themselves, but remain out by a factor of 10 !
and again:
“According to the IPCC’s own data, man-made CO2 output levels are 3% of 3% of 0.1% of the total Earth’s atmosphere. That’s 0.000009%! That’s 9 millionths.” This should be 3% of 0.041% of Earth’s DRY atmosphere, because as of Sept 2019 the CO2 dry measure is 410ppm. Next 0.0000009% is 0.9 millionths. Finally once you add in the 1.5% water vapour, and your final figure should be 0.000012% which is 12 millionths.
Your figures are sometimes almost right, and at other times out by a factor of ten. This might put some readers off skepticsm of anthropogenic climate change !
Thanks, George. -g