
Michael Noonan – A proverbial picture [chart], being worth 1,000 words, we will let the charts speak for themselves, with observations/comments attached to each one.
From our perspective, the charts are saying, irrespective of what anyone is reading or following regarding gold and silver, there appears to be no change in trend for the near term. The state of China’s economy; possible confrontation between China and the US now sending ships to irritate/challenge China’s control over it part of the ocean where she is building new bases; flagging response to the Fed’s ongoing failure of injecting more and more fiat in an already over bloated fiat economy, in fact, world-wide; Russia’s ongoing embarrassment of Washington with Russia’s pinpoint air force accuracy bombing ISIS terrorists, and commensurate challenge of taking control of the Mid East from the flailing Sunni Arab coalition, Western political disarray, etc, etc, etc.
Then there is the never-ending slew of new directly related information as to facts and fundamentals about gold and silver and the ever-missing market interpretations arising from all available information.
As we always maintain, charts are the cumulative distillation of all news and also the input from all buyers and sellers that can impact the market that would otherwise be impossible to assemble and then assimilate in order to make sense of it all. The charts’ developing market activity accomplishes that. It then becomes a function of how well the charts can be understood in the message[s] being conveyed for all to see.
The most obvious competition for Precious Metals [PMs], is fiat currency, and no country has been more manipulative in internationally suppressing the price of gold than the US Federal Reserve, aided and abetted by the corporate federal government. It is a perfect cover for the international elite bankers/globalists pulling the strings behind government, while at the same time, having the masses believe it is the government actually in control.
It is impossible to keep issuing endless amounts of fiat without eventually destroying the economy, and this has been on an international scale via the IMF, BIS, and central banks. It is a testament to the insidious strength of the globalists to subvert and distort the world economy and still maintain control over those being ruled.
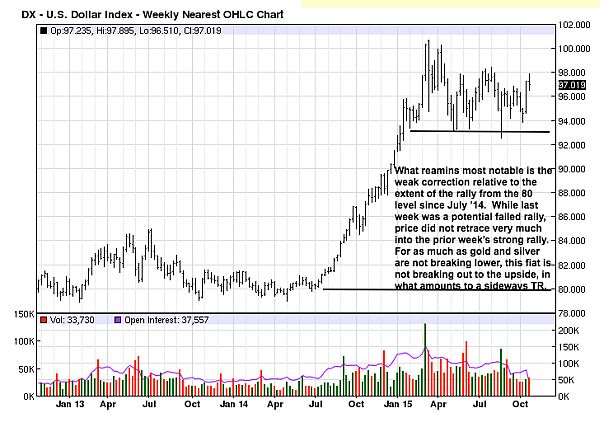
The US-issued fiat Federal Reserve Notes, widely accepted as “dollars,” has maintained its
relative strength, as noted by what appears to be a weak reaction, [see chart],given the degree of the rally from the 80 area. What we know about weak reactions [pullbacks in a rally], is that they almost always lead to higher prices.
The premise behind that observation is simple. If sellers have spent as much effort as they can to get price lower, and all they can accomplish is a mild correction, it is an indication that the market is in stronger hands preventing price from going lower. Once the sellers have expended themselves, new buyers, recognizing that price has held well, will rush in and add to the demand to push price higher.
The sideways TR since the March ’15 high has the earmarks of a weak reaction, holding the 93 area on each attempt to breach that level and take price lower. The failed August probe lower has held twice in retest attempts, the latest 3 weeks ago. Some might interpret last week’s failed retest of 98 and lower close as negative. While the range is smaller, indicating a lack of buyer ability to maintain the rally, but equally compelling is the fact that the sell off did not make much progress moving price lower. TRs [Trading Ranges], can be difficult to trade because price is failing to go to newer highs or newer lows. Best to let the TR play itself out and “go with” the confirmed directional breakout.
Twelve times a year, we get to present the monthly charts in order to keep a higher time frame perspective. Higher time frames are much harder to turn and change trend, so it pays to always be aware of what a monthly chart is indicating. A fact that all can agree on is that price is at recent lows when compared to the 2011 highs. That indicates the trend is down. It would be impossible to argue otherwise, whether one is an experienced chart reader or has no experience. Continue reading . . .
Michael Noonan is a Contributing Writer for Shift Frequency
SF Source Edge Trader Plus Oct 2015
[widget id=”text-44″]